OpenTelemetry Collector: The Observability Swiss Army Knife You Haven’t Discovered Yet
The Tool That Changed How I Think About Observability Pipelines
After fifteen years of wrestling with monitoring systems that felt like they were built by committee, I’ve found something that actually makes sense. The OpenTelemetry Collector isn’t the flashiest tool in the observability space, but it’s quietly become the backbone of every serious monitoring setup I’ve architected in the past two years. While everyone’s debating Prometheus versus Grafana Cloud or arguing about which APM vendor has the best UI, the real innovation is happening in the data pipeline layer.
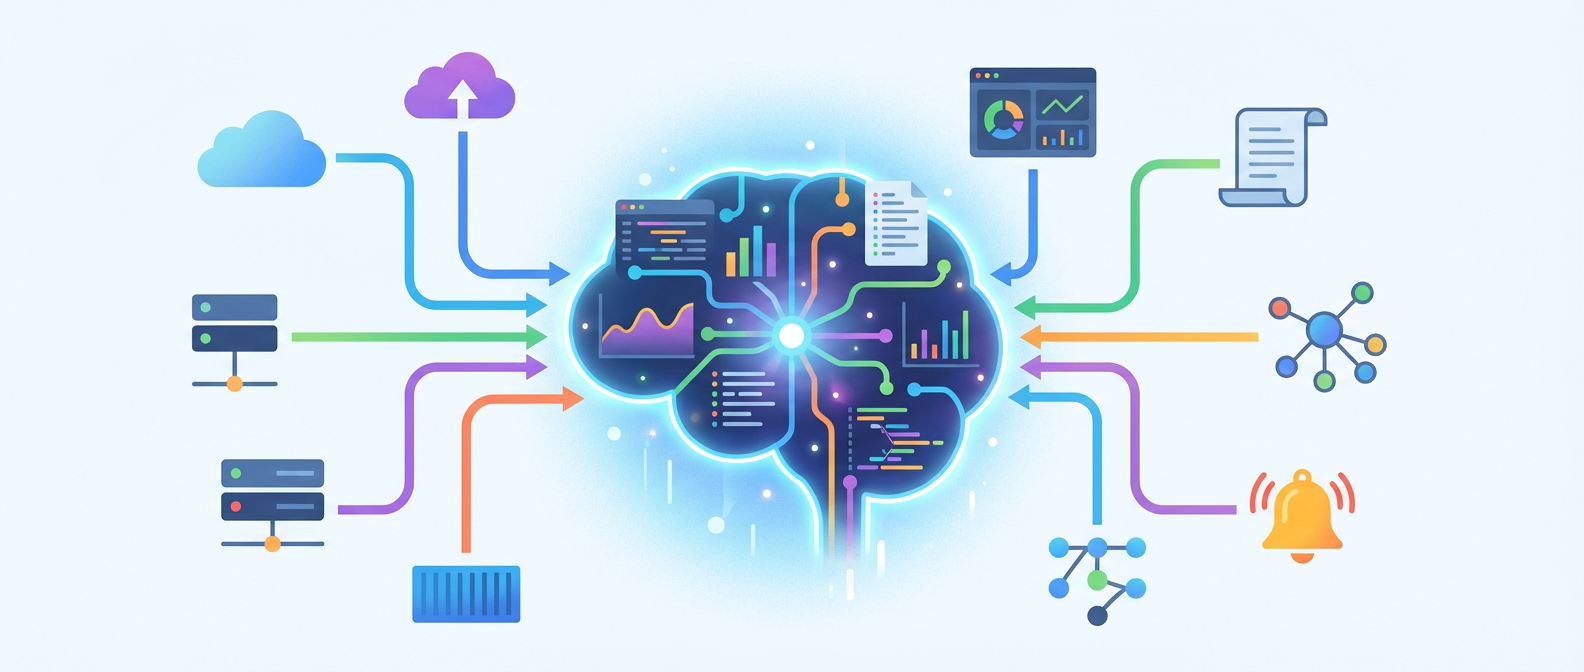
The Collector solves a problem that most teams don’t realize they have until they’re drowning in it. You start with a simple setup: application metrics go to Prometheus, traces go to Jaeger, logs go to Elasticsearch. Six months later, you’re managing seventeen different agents, each with its own configuration format, resource requirements, and failure modes. The Collector turns all of this into a single, configurable pipeline that can receive, process, and export telemetry data in dozens of formats.
What makes this particularly compelling is the architecture. Instead of being a monolithic black box, the Collector is built from composable components. Receivers handle data ingestion, processors transform and enrich the data, and exporters send it to your backend systems. This modular approach means you can start simple and add complexity only where you need it. I’ve seen teams replace six different agents with a single Collector deployment that actually uses fewer resources than what they had before.

Why Traditional Monitoring Stacks Fall Apart at Scale
The conventional wisdom in observability is to pick best-in-class tools for each data type and glue them together. This works fine when you have three services and one engineer. But I’ve watched this approach collapse under its own weight more times than I care to count. The problem isn’t the individual tools. It’s the integration surface area.
Each monitoring agent brings its own failure modes. The Prometheus node exporter might crash silently. The Fluent Bit log shipper might start dropping data under load. Your APM agent might decide to stop sending traces after a deployment. When you’re troubleshooting a production incident, the last thing you want is to question whether your monitoring system is telling you the truth.
The Collector addresses this by giving you a single point of configuration and observability for your entire telemetry pipeline. Its internal metrics tell you exactly what’s happening to your data as it flows through the system. You can see how many spans are being processed per second, which processors are adding latency, and whether any exporters are experiencing backpressure. This level of introspection into your monitoring system itself is something I never knew I needed until I had it.
Real-World Implementation: Beyond the Marketing Demos
Let me walk you through a deployment that actually matters. We had a microservices architecture generating about 50GB of telemetry data daily across traces, metrics, and logs. The existing setup involved separate agents on each host, multiple configuration management systems, and a deployment process that took two hours because we had to coordinate updates across different teams responsible for different parts of the stack.
The Collector deployment started with a simple gateway pattern. All applications send their telemetry to local Collector instances running as sidecars, which then forward to a set of centralized Collector gateways. This topology gives you the best of both worlds: local buffering and processing for resilience, plus centralized control for routing and transformation logic.
The real power became apparent when we needed to add sampling to reduce trace volume by 90% while preserving error traces and high-latency requests. With our old setup, this would have required updating application code or reconfiguring multiple systems. With the Collector, it was a single processor configuration that took effect across the entire fleet within minutes. The probabilistic sampling processor handles the random sampling, while the tail sampling processor makes intelligent decisions based on trace attributes after seeing complete traces.
Performance-wise, the Collector consistently uses less memory and CPU than the combined agents it replaced. A single instance can handle hundreds of thousands of spans per second while maintaining sub-millisecond processing latency. The key is understanding the component pipeline and configuring appropriate batch sizes and queue lengths for your workload characteristics.
The Configuration Patterns That Actually Work
The Collector’s flexibility is both its greatest strength and its biggest pitfall. The configuration format is powerful enough to handle complex routing and transformation logic, but it’s easy to overcomplicate things. After deploying this in production environments ranging from startup scale to enterprise complexity, I’ve identified a few patterns that consistently work well.
Start with the gateway deployment pattern I mentioned earlier, but resist the urge to put all your logic in the centralized gateways. Keep the edge Collectors simple: basic receivers, minimal processing, and reliable exporters. Put your complex transformation logic in dedicated processing stages that you can scale and update independently. This separation of concerns makes troubleshooting much easier when things go wrong.
For high-volume environments, the batch processor configuration is critical. The default settings are conservative and will create unnecessary network overhead. I typically start with batch sizes of 8192 spans or 1MB, whichever comes first, with a timeout of 1 second. These settings balance latency with efficiency, but you’ll need to tune based on your specific traffic patterns and downstream system capabilities.
Resource detection is another area where the defaults don’t match real-world deployments. The Collector can automatically detect and add metadata about the environment it’s running in, but you need to explicitly configure which detectors to use. For Kubernetes deployments, enabling the k8s and env detectors will automatically tag your telemetry with pod names, namespaces, and environment variables. This metadata becomes invaluable when you’re trying to correlate issues across your infrastructure.
What This Means for the Future of Monitoring
The Collector represents a fundamental shift toward treating observability data as a first-class concern. Instead of bolting monitoring onto applications as an afterthought, we’re building dedicated infrastructure for telemetry data with the same care we put into our primary data pipelines. This approach scales in ways that traditional monitoring architectures simply can’t.
What excites me most about this direction is the ecosystem that’s emerging around it. The OpenTelemetry community is building processors for everything from PII redaction to intelligent sampling to real-time anomaly detection. These aren’t vendor-specific solutions locked into particular platforms. They’re composable components that work regardless of where you’re sending your data.
The Collector is also becoming a platform for innovation in ways I didn’t expect. Teams are using it for near-real-time alerting by connecting processors to external systems, for data enrichment by joining telemetry with business context, and for compliance by implementing data governance policies at the pipeline level. Once you have a programmable telemetry infrastructure, the use cases multiply quickly.
If you’re dealing with the complexity of modern observability stacks, the OpenTelemetry Collector deserves serious consideration. It’s not a silver bullet, but it’s the closest thing I’ve found to a universal solution for telemetry data management. Start with a simple deployment, learn the configuration patterns, and gradually migrate your existing agents. The time you invest in understanding this tool will pay off as your systems grow more complex.

How MEV Extraction Quietly Penalizes Regular Users

The Evolution of Go’s Memory Management: From GC Tuning to Predictable Performance

Distributed Consciousness: The Sci-Fi Dream Turned Reality
About Author
